
Statistics
Summary statistics for 2017 in the CR
- In year 2017 was built one project Václavice - park with 11 wind power plants
- The YoY increase in installations of wind energy is in 26,1 MW
- The total wind installations to 31 December 2017 = 309,1 MW
.jpg)
Note:
| Wind energy production in months in years (MWh) |
||||||||
| Month | 2009 | 2010 | 2011 | 2012 | 2013 | 2014 | 2015 | 2016 |
|---|---|---|---|---|---|---|---|---|
| January | 15696 | 12454,4 | 30312,1 | 71897,8 | 43638,7 | 37654,1 | 71661,1 | 50700 |
| February | 29182 | 23063,2 | 30251,9 | 38974,4 | 33404,3 | 45214,3 | 41085,9 | 67500 |
| March | 35795 | 41416,3 | 33986,7 | 32553,9 | 47015,6 | 49493,4 | 60281,3 | 42600 |
| April | 18384 | 24058,4 | 37232,6 | 30364,6 | 30687,3 | 34050 | 52130,8 | 37800 |
| May | 20601 | 30288,7 | 23789,5 | 31238,1 | 35719,0 | 49200 | 36334,6 | 44000 |
| June | 24167 | 25928,9 | 29489,1 | 26083,1 | 34706,5 | 25260,6 | 33332,4 | 20600 |
| July | 20397 | 17103,8 | 37331,3 | 27714,9 | 22872,6 | 22313 | 37571,1 | 30800 |
| August | 17110,3 | 26563,5 | 21180,6 | 19392,6 | 23453,2 | 25305,9 | 28275,7 | 25700 |
| September | 18698,9 | 30201,0 | 21642,2 | 25842,1 | 43282,9 | 33335 | 40961 | 25100 |
| October | 33938,5 | 34852,9 | 39091,6 | 29831,4 | 48965,6 | 38211,8 | 34311,8 | 41000 |
| November | 32002,8 | 36506,6 | 30522,6 | 37566,4 | 54843,1 | 43243,9 | 70739,9 | 50000 |
| December | 23915,5 | 33203,4 | 62252,4 | 44117,4 | 60261,5 | 69190,3 | 65077,7 | 61100 |
| Total | 289888 | 335641,1 | 397082,6 | 415576,7 | 478850,3 | 472472,3 | 571763,3 | 496900 |
Wind energy production in months in years (MWh)
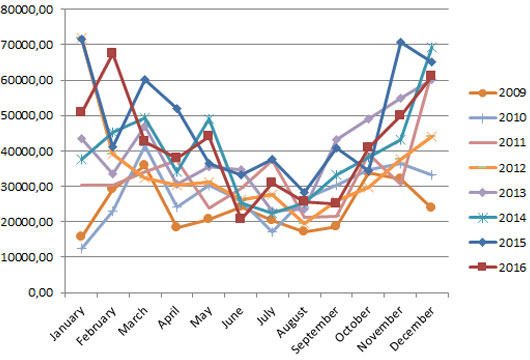
Pozn.: Hodnoty v tabulce jsou čerpány z portálu ERÚ, který je zveřejňuje s 2-3 měsíčním zpožděním.
.jpg)
| Total installation of WTGs (in GWh) | |
| Year | Energy production |
|---|---|
| 2005 | 21,3 |
| 2006 | 49,4 |
| 2007 | 125,1 |
| 2008 | 243,9 |
| 2009 | 289,9 |
| 2010 | 335,6 |
| 2011 | 397,1 |
| 2012 | 415,6 |
| 2013 | 479,0 |
| 2014 | 472,4 |
| 2015 | 572 |
| 2016 | 496,6* |
*Brutto
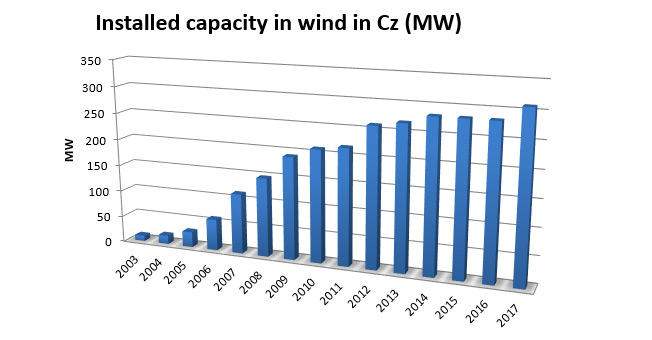
| Total installation of WTGs (in MW) | ||
| Year | Total | Annual growth |
|---|---|---|
| 2005 | 28 | |
| 2006 | 54 | 26 |
| 2007 | 116 | 62 |
| 2008 | 148 | 32 |
| 2009 | 192 | 44 |
| 2010 | 215 | 23 |
| 2011 | 217 | 2 |
| 2012 | 260 | 43 |
| 2013 | 269 | 9 |
| 2014 | 283 | 14 |
| 2015 | 283 | 0 |
| 2016 | 0 | 0 |
| 2017 | 309,1 | 26,1 |
Source: ERÚ (Energy Regulatory Office)
